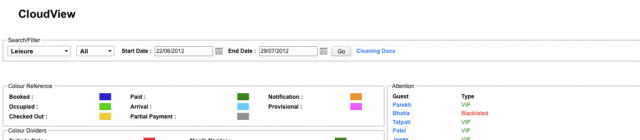
CloudView
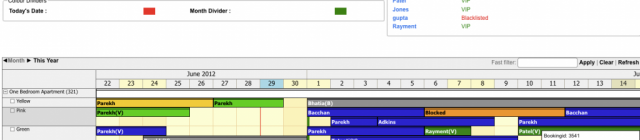
View your bookings at a glance with CloudView
Read more
If you want to send out newsletters to your customers and want to export their data, or if you want to analyse your financial data in your own way, you can filter and sort your data to make a bespoke report and export them by following the steps laid out in this video.
On the menu bar, click on Reports. This will open a drop down menu. There are three options. Click on Financial Reports if you want to view reports based on your financial data, such as Profit & Loss, Balance Sheet and Trial Balance. Click on Management Reports if you want to view Key Performance Indicator reports, such as RevPAR, or if you want to see which employees are selling the most rooms or how much you owe agents. Click on Operational Reports if you want to view reports for the day-to-day running of you business, such as Today’s Check-in or the number of Empty Rooms. For easy access, some of these operational reports can also be found by clicking on Bookings on the menu bar.
There are many grids displayed throughout the system. They list information in a simple and clear format. Data in the grids can be manipulated so you can produce a bespoke report.
Firstly, there is the filter option. If there are search boxes, like these, underneath the column headers, then you can type in them to narrow down what information appears in the grid. This filter icon that is to the right of the search box can be clicked if you want your filter to search by something other than “Contains.” When you click on the filter icon you can select your desired filter, such as “EqualTo” and “LessThan” from the dropdown that appears.
Secondly, there is a sort option. If there is a “Drag a column header and drop it here to group by that column” message at the top of a grid, you can organise the data by a particular column. For example, if you wanted to organise a report by date, then you would drag and drop the Date column header to the top of the grid. The grid will then reorganise the information into separate sections distinguished by the date of the record.
Finally, there is an export option. If there is an Export Configuration section below the grid, you can choose what information is exported by ticking the relevant boxes, whether it is Data Only, Currently Sorted data, Currently Filtered data or a combination of these three. To export the grid, click on one of the export icons on the top right corner of the grid. The exported file will download to your default download folder.
You have now successfully viewed and manipulated reports. For more information about reports, see our User Guide, section 5.
If you want to view your bespoke reports based on customer and booking information, such as see the analysis of guests that visit from abroad, view the reports that show how popular parking spaces are or export the data generated by the analytic report facility, then watch this video…
To use the bespoke reporting facility, you will need to have set up the appropriate parameters for the report in configuration. For more information on setting up these reports, please watch How to Set up Your Own Analytic Reports or see our User Guide, section 1.7.
The first type of bespoke reports is based on bookings made by guests. On the menu bar, click on the tab called Reports. This opens a dropdown menu. Click on Management Reports. This opens a side menu. Click on Analytic Parameters. This opens a side menu. Click on Booking Parameters.
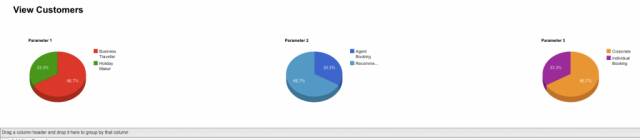
This opens a Booking Parameters page that has three pie charts displayed at the top of the page and a grid with booking information displayed at the bottom of the page.
These pie charts display the percentage of each parameter selected in a booking for the dates and CloudView selected in the Search / Filter section. For more information on how to add parameters to a booking, please watch the video How to Edit Booking Details or see our User Guide, section 3.2.
To view your bespoke reports for a different set of dates or for different properties, click on the calendar icon to the right of the From and To dates, and click on your desired date or choose a CloudView by clicking on the dropdown and selected your required property. Once you have made your selection, click on Go. This updates the pie charts and the grid with the relevant information.
If you want to export the data in the grid so you can compare the parameters against each other or against the property booked or the amount paid by guests, you can do so by exporting the grid. Use the Export Configuration section at the bottom of the page to select the style of information you would like to export, and then click on one of the export icons on the top right of the grid to export to your preferred format. For more information on exporting grids please watch the video, How to use the ALAVEX system or How to View and Utilise Reports or refer to our User Guide, section 5. The file will download to your default download folder.
The second type of bespoke report is based on customer information. On the menu bar, click on the tab called Reports. This opens a dropdown menu. Click on Management Reports. This opens a side menu. Click on Analytic Parameters. This opens a side menu. Click on View Customers. Alternatively, you can reach this page by clicking on Corporate / Customers and then clicking on View Customers from the dropdown menu.
This opens a View Customers page that has three pie charts displayed at the top of the page and a grid with customer information displayed at the bottom of the page.
These pie charts display the percentage of each parameter selected in customers’ details. For more information on how to add parameters to customer information, please watch the video How to Add or Edit Customer Information or see our User Guide, section 4.1.
If you want to export the data in the grid so you can compare the parameters against each other or against other column in the grid, you can do so by exporting the data in the same way as described earlier. For more information on exporting grids please watch the video, How to use the ALAVEX system or How to View and Utilise Reports or see our User Guide, section 5. The file will download to your default download folder.
You have now successfully viewed and exported your bespoke analytic reports.